What You Need to Know About Radon
Radon is a cancer-causing, radioactive gas. Radon levels cannot be predicted based on state, local or neighborhood radon measurements. Homes which are next to each other can have different indoor radon levels. Radon typically moves up through the ground to the air above and into your home through cracks and other holes in the foundation. Your home can then trap radon inside.
Radon cannot be seen, smelled or tasted, but it may be a problem in your home. When air that contains radon is breathed, you increase your risk of getting lung cancer. In fact, the Surgeon General of the United States has warned that radon is the second leading cause of lung cancer in the United States today.
The EPA and the Surgeon General recommend testing all homes for radon. The EPA recommends that a home is fixed if the radon level is 4 picoCuries per liter (pCi/L) or more. Radon levels less than 4 pCi/L still pose a risk, and in many cases may be reduced. For more information about radon, visit www.epa.gov.
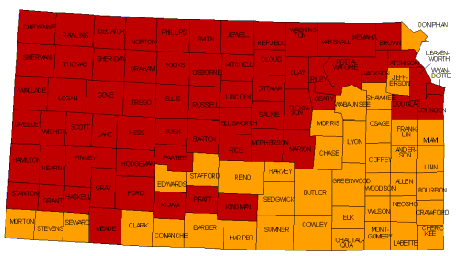
EPA Map of Radon Zones for Missouri & Kansas
 |
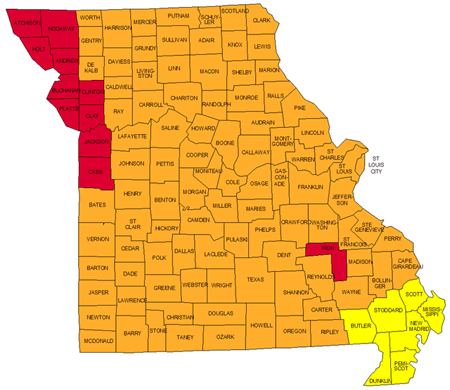 |
| Kansas | Missouri |
The purpose of this map is to assist National, State, and local organizations to target their resources and to implement radon-resistant building codes. This map is not intended to be used to determine if a home in a given zone should be tested for radon. Homes with elevated levels of radon have been found in all three zones. All homes should be tested regardless of geographic location.
Important points to note:
- All homes should test for radon, regardless of geographic location or zone designation
- There are many thousands of individual homes with elevated radon levels in Zone 2 and 3. Elevated levels can be found in Zone 2 and Zone 3 counties.
All users of the map should carefully review the map documentation for information on within-county variations in radon potential and supplement the map with locally available information before making any decisions.
The map is not to be used in lieu of testing during real estate transactions.
The Map was developed using five factors to determine radon potential: indoor radon measurements; geology; aerial radioactivity; soil permeability; and foundation type. Radon potential assessment is based on geologic provinces.
Radon Index Matrix is the quantitative assessment of radon potential. Confidence Index Matrix shows the quantity and quality of the data used to assess radon potential. Geologic Provinces were adapted to county boundaries for the Map of Radon Zones.
Sections 307 and 309 of the Indoor Radon Abatement Act of 1988 (IRAA) directed EPA to list and identify areas of the U.S. with the potential for elevated indoor radon levels. EPA’s Map of Radon Zones assigns each of the 3,141 counties in the U.S. to one of three zones based on radon potential:
![]() Zone 1 counties have a predicted average indoor radon screening level greater than 4 pCi/L (pico curies per liter) (red zones) Highest Potential
Zone 1 counties have a predicted average indoor radon screening level greater than 4 pCi/L (pico curies per liter) (red zones) Highest Potential
![]() Zone 2 counties have a predicted average indoor radon screening level between 2 and 4 pCi/L (orange zones) Moderate Potential
Zone 2 counties have a predicted average indoor radon screening level between 2 and 4 pCi/L (orange zones) Moderate Potential
![]() Zone 3 counties have a predicted average indoor radon screening level less than 2 pCi/L (yellow zones) Low Potential
Zone 3 counties have a predicted average indoor radon screening level less than 2 pCi/L (yellow zones) Low Potential
IMPORTANT: Consult the EPA Map of Radon Zones document (EPA-402-R-93-071) before using this map. This document contains information on radon potential variations within counties. EPA also recommends that this map be supplemented with any available local data in order to further understand and predict the radon potential of a specific area. If you have questions about radon in water, see www.epa.gov or contact your State Radon Coordinator.